This is the fifth tutorial in our UFT tutorial series. In this tutorial we will go into the details of UFT panes and we will discuss all the panes available within the UFT IDE. 
UFT’s user interface has witnessed a lot of change in the past few years. If you are someone who is migrating from QTP 11 or earlier versions you will find that not only has HPE added extra panes, they have replaced the panes found in earlier versions with the new ones.
Here is the list of all panes available in UFT. We will go through each of them one-by-one.
Solution Explorer Pane
Before we talk about Solution Explorer Pane, we need to first understand Solution
What is a Solution in UFT?
Solution is a collection of testing documents. The testing documents can be function libraries, actions, object repositories. Solution in UFT provides you a way to view, edit and manage all your testing assets (GUI based or API based) from a single location. Solutions are stored in your file system in a HP proprietary format .ftsln
In layman terms, Solution can be thought of as a binder where you can ‘bind’ or ‘keep’ all your testing assets together for an easy access. When you create a new Test in UFT, a Solution Untitled is created automatically along with it. You can rename the Solution by right clicking on it > Save As…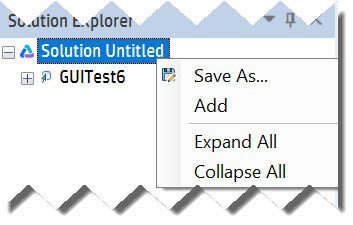
Alternatively, you can create a New Solution by going to File > New > New Solution…. 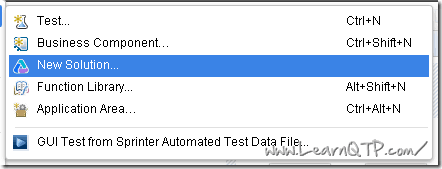
What is Solution Explorer Pane in UFT?
Solution Explorer Pane can be used to view and manage the Solution(s). Solution Explorer Pane comes up on the left hand side inside the UFT IDE as soon as you launch UFT. 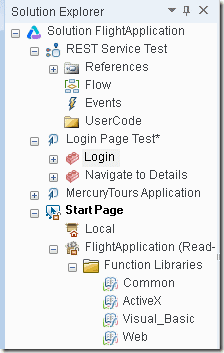
ToolBox Pane
The Toolbox Pane displays the test objects/library functions/local functions available to the action that is currently in focus. It enables you to view and drag and drop these objects/functions into your action or component. Available Keywords pane in QTP 11 was renamed to ToolBox in UFT 11.5. 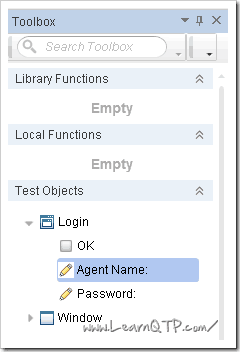
Document Pane
This is the main design area in the center of UFT IDE. All documents opened in the document pane are displayed as separate tabs. The complete area inside the red border in the image below is Document Pane. 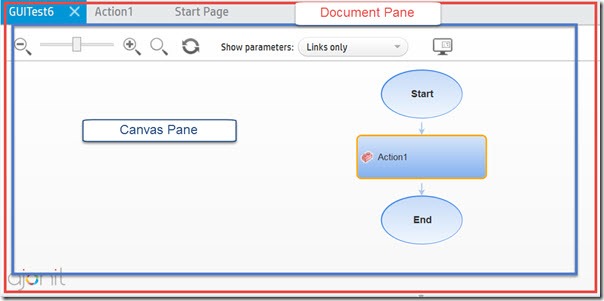
Canvas Pane
Canvas Pane provides a pictorial representation of GUI or API test flow. As can be seen in the image above – bordered blue – Canvas Pane opens as a tab inside the Document Pane. You can right click on the individual actions in the flow and access various settings related to that action.
Canvas Pane closed. It can improve UFT performance.Keyword View and Editor
An action in UFT can be designed and viewed in two ways; Keyword View and Editor.
Keyword View enables you to view the action steps in a tabular excel-sheet-like format. Editor is much more powerful and allows you to create/edit scripts , write logical statements in a more natural fashion. Almost all UFT engineers create and design their scripts in UFT Editor.
Since time immemorial (in QTP 11 and earlier versions), the toggling between Keyword view and Expert View (editor) was available through a tabbed interface in IDE. 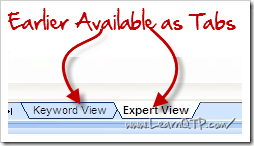
With UFT 11.5 and above versions, this toggling is now available through the tool bar at the top. (as shown in animation below) 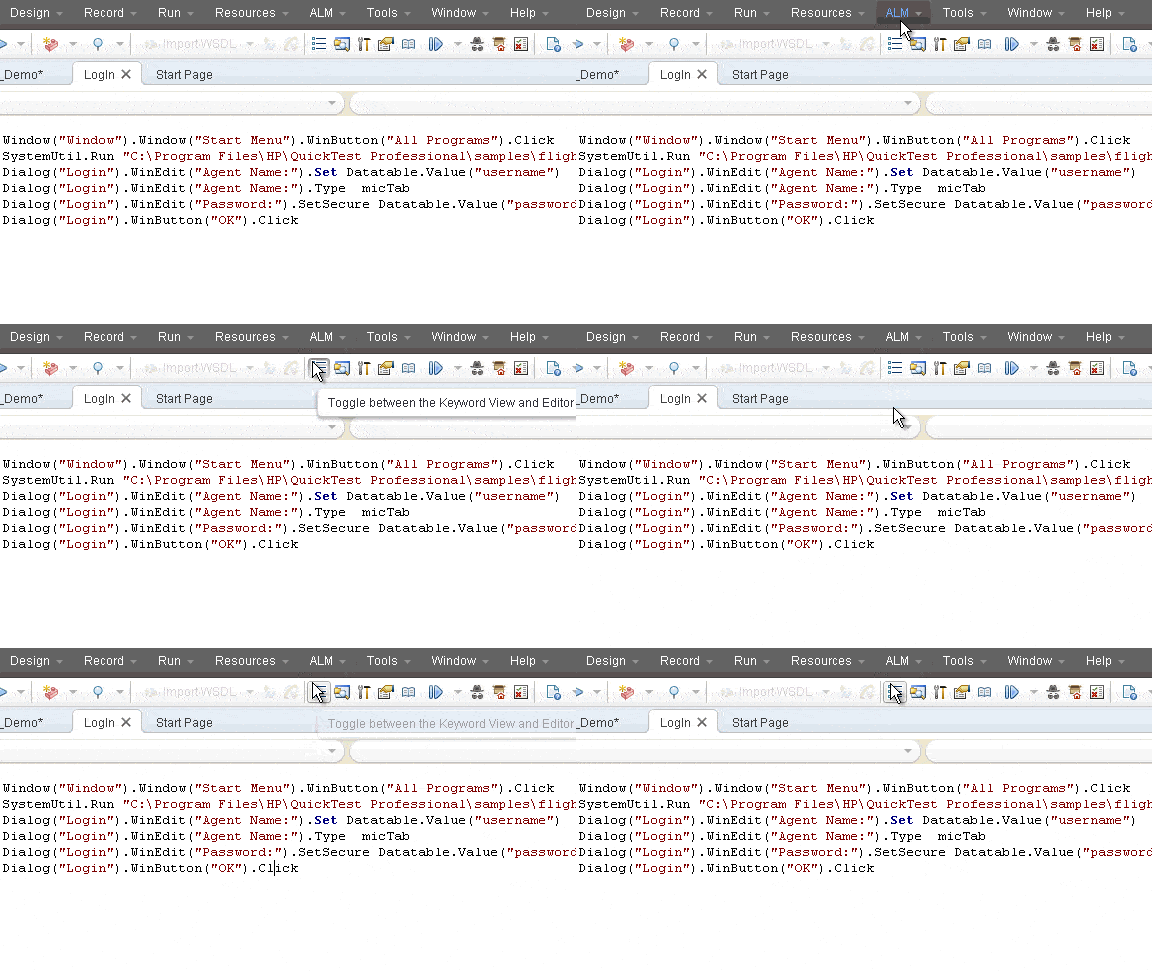
Output Pane
Output Pane displays info that is set to be output from a given test. Output Pane is available below the Document Pane.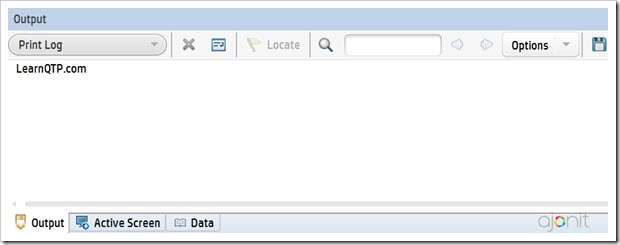
- Shows you the output sent using
Printutility statement. - Shows missing resources during a run session. As an example, if you are trying to load a function library during the run-time and for any reason, function library fails to load, Output Pane will show you the relevant details.
Active Screen Pane
When you record a test, UFT takes a screenshot of each-and-every screen it encounters during recording. These screenshots are saved with your tests and are known as Active Screen in UFT.
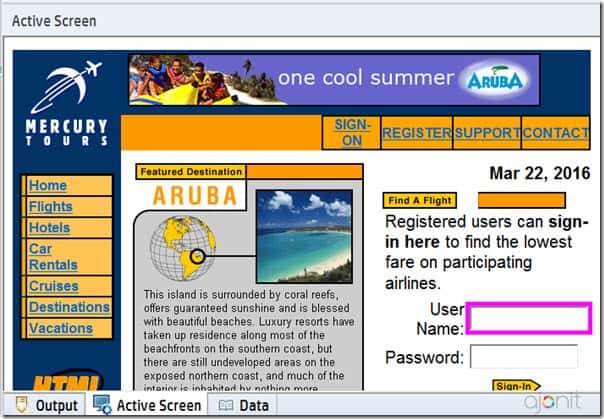
Active Screen Pane can be seen below the Document Pane and it is available as the 2nd tab after the Output Pane tab.
Data Pane
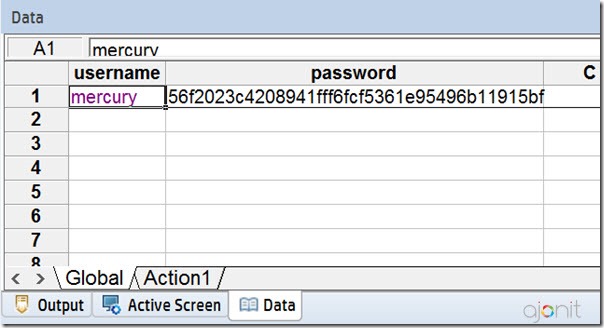
Data Pane consists of data sheets where you can parameterize your tests. Normally this would be the first method you will learn on how to parameterize tests in UFT. Data Pane is available as the 3rd tab, just after the Active Screen tab.
Debug Panes
Debug Pane allows you to debug tests and functions libraries using debugging capabilities within UFT and VBScript. To use UFT debugger you should ensure that Microsoft Debugger is installed in your machine. Since July 2016, Microsoft has removed MS Debugger from their servers. Until it comes back, follow this article on how to download and install MS debugger
Debug pane is not actually a single pane rather it is a collection of sub-panes which can be activated by going to View -> Debug 
- Breakpoints Pane: Shows all the breakpoints in the editor.
- Call Stack Pane: Shows detail about the methods and functions on the call stack. Test is in paused mode during this time.
- Local Variables Pane: It displays the values of variables and their types in the current action/function library.
- Console Pane: You can inject VB Script or C# code in the console to retrieve information from the application or change variable values during current run session.
- Watch Pane: It displays the values of selected variables and their types in the current action/function library. The difference between Local Pane and Watch Pane is that while in local variables you view the value of ALL variables, in the watch pane you can view value of variables selected by you.
Properties Pane
Properties pane is available as a tag on the right side of IDE. It can also be accessed using View -> Properties or a keyboard shortcut Ctrl + Alt + P.
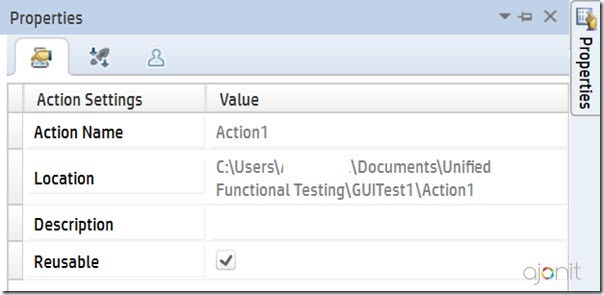
Properties pane can be used to:
- view/modify properties of a test
- make an action Reusable to Non-Reusable and vice versa
- add input/output parameter to a test.
Bookmarks Pane
Bookmarks in UFT are like a marker which can be put on any statement in a given script.
Bookmarks Pane can be accessed using View > Bookmarks. All bookmarks are neatly stacked in the Bookmarks Pane. You can jump to any bookmark by clicking on the corresponding line in the Bookmarks Pane.
A bookmark can be inserted by opening the bookmarks pane and clicking ▢ while your mouse cursor is placed on the corresponding statement in Editor.
Errors Pane
 The
The Errors Pane can be used to locate:
- syntax errors
- missing resources
- missing references
- missing property values
This pane can be accessed from View –> Errors or keyboard shortcut Ctrl+Alt+E.
Run Step Results Pane
The Run Step Results Pane displays the results of a single step performed using the Run Step command.
Tasks Pane
The Tasks Pane enables you to view and access TODO comments in actions and function libraries. 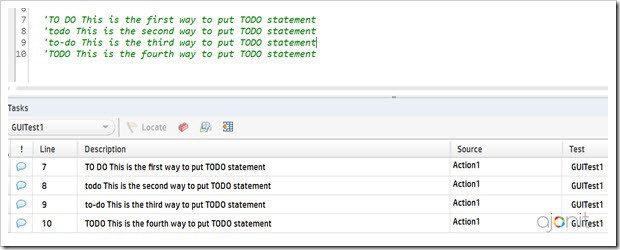
You can insert TODO comments inside editor or a function library by beginning a statement with:
‘To Do‘todo‘to-do‘TODO
With this we come to the end of UFT tutorial #5. In this tutorial, we discussed all panes available within the UFT IDE. In case you have any question, please use the comments section below.
You can refer the earlier tutorials in the UFT tutorial series using the links below:
- Tutorial 1: Introduction to software testing
- Tutorial 2: introduction to UFT
- Tutorial 3: UFT Add-ins and Add-in Manager
- Tutorial 4: All About UFT Menus
- Tutorial 5: Complete Guide to UFT Panes
- Tutorial 6: Record Your First UFT Script
Enter your name and address below to receive the next tutorial as soon as it is ready.



Gr8 tutorials, please upload more on it with examples.
Thanks Max! There are lot more tutorials to come. Stay tuned! You can subscribe to the tutorials by entering your name and email address in the subscription form above.
we have command tab(watch,variable,command) exists in the qtp but unable to find in UFT. please provide me solution.
@Ravikiran: As mentioned in the article above, you can enable them by going to
View> Corresponding tab.